
Overview
Maps of forest species-climate profiles were developed to help predict how forests, plant communities, and species may change on the landscape in response to climate change. Each species map depicts a ‘viability score’, which is an index on the interval zero to one that indicates how consistent the climate at a location is with the contemporary occurrence of a species. A low score at a given point in time or space indicates that the species does not occur (or very rarely occurs) in climates like those depicted at that location. High scores indicate that the climate is consistent with places where the species occurs. A reasonable way to use these maps is to identify locations where a species is may be in trouble and where it may have future opportunities. See Rehfeldt and Jaquish (2010) for an example of applying this kind of information to the management of western larch. Other examples are documented, see the list of publications.
Maps are available for 76 different tree species that occur in the western United States. Each species has a map showing current suitable habitats, as well as several maps showing potential future suitable habitats. Maps of future projections are based on climate data from three global climate models (GCMs), and four different emissions scenarios, although the emissions scenario used depends on the specific GCM. Maps of future predictions are offered for the years 2030, 2060, and 2090.
See more in the Inputs and Outputs section on how maps were generated.
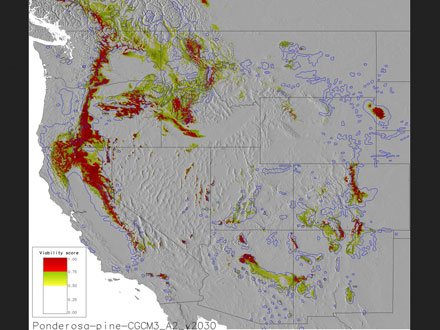
A map of likely suitable climate for Ponderosa pine for the year 2030, using the CGCM3 climate model and the A2 emissions scenario.
History
Researchers at the Moscow Forestry Sciences Laboratory have been working on the elements of mapping future climate suitability since about 2003, with the first key publication appearing in 2006 (Rehfeldt et al. 2006). Researchers are expanding on the work that went into these maps by using the viability scores for individual tree species in the Forest Vegetation Simulator (FVS). The Climate-FVS modification is designed to take climate change into account when predicting forest dynamics at decadal to century time scales, and is available from the Forest Management Service Center.
Inputs and Outputs
Inputs:
To generate these maps, researchers used methods introduced by Rehfeldt et al. (2006). This method uses Forest Inventory and Analysis data on tree species presence/absence, climate data generated using climate modeling methods from Rehfeldt (2006), and Random Forests classification trees (Breiman 2001; Liaw and Wiener 2002)to develop plant-climate relationships. The areas where climate is most likely to be suitable for a certain species can then be mapped. For future climates, climate data were modified using information from three GCMs.
GCM data and emissions scenarios used in these maps are from the Third Intergovernmental Panel on Climate Change Assessment (2007).
GCMs:
CGCM3 - Canadian Center for Climate Modeling and Analysis
GFDLCM21 - Geophysical Fluid Dynamics Laboratory
HADCM3 - Hadley Center/World Data Center
Emissions Scenarios:
A1B, A2, B1, B2 – see http://sedac.ipcc-data.org/ddc/sres/ for further explanation.
Outputs:
Each map displays a viability score. The viability score is a species-specific estimate of the likelihood that climate at that point is suitable. The higher the viability score, the more likely it is that the climate is suitable for that species.
Restrictions and Limitations
It is important to note that these models attempt to describe climate suitability only, not where species themselves will be located. There are many other factors that may determine where plant species occur that are not included in these models, such as dispersal, competition, evolutionary change, increased carbon dioxide, and changes in disturbance regimes. These maps also do not account for factors outside of climate that may contribute to habitat suitability, such as soil type or soil moisture.
Finally, it is important to recognize that the current relationship between a species and climate may not remain constant under warmer climates, which makes it difficult to assume that models can make projections into novel climates. As with most climate-species predictions, these maps are best used to compare a range of possible future scenarios, rather than as depictions of exact outcomes.
The accuracy of the maps depends on the accuracy of the data that went into each step of building the maps. For the “current” climate suitability maps these include:
- The underlying climate data gathered from weather stations and developed into climate models.
- “Spline” models representing contemporary climate – these are used to provide estimates of climate for specific points on the geographic surface (e.g., Rehfeldt 2006)
- Plant presence and absence data.
For maps representing future suitable climate, accuracy also relies on:
- The underlying general circulation model (GCM) used to predict future climate.
- The method used to down scale the GCM outputs.
Accessing the tool and additional information
Main forest climate change page: http://forest.moscowfsl.wsu.edu/climate/
Plant Species and Climate Profile Predictions: http://forest.moscowfsl.wsu.edu/climate/species/index.php
Publications related to or resulting from this work: http://forest.moscowfsl.wsu.edu/climate/publications.php