U.S. flag

An official website of the United States government

NorEaST - Stream Temperature Web Portal

Overview & Applicability

Stream data are needed to enable managers to understand baseline conditions, historic trends, and potential impacts of climate change on stream temperature and flow, and in turn on aquatic species in freshwater ecosystems.

NorEaST aggregates steam temperature data from the northeastern and midwestern U.S. into an online map interface linked to temperature datasets. The project is in progress, and currently contains mapped locations and metadata for more than 9000 stream monitoring locations. Many of the stream temperature datasets associated with these points are forthcoming.

A screenshot of stream temperature sample locations from NorEaST

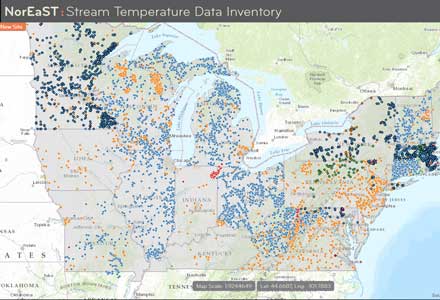
The NorEaST online map interface will eventually be linked to thousands of temperature datasets.

History

A number of collaborators from organizations including the USGS ( Great Lakes Science Center, Massachusetts Water Science Center, and the Wisconsin Water Science Center), University of Wisconsin Platteville, Michigan State University, and University of Massachusetts Amherst,. Over 47 organizations contributed data to the effort. Collaborators and their roles are described more thoroughly on the project webpage: https://necsc.umass.edu/projects/noreast-%E2%80%93-stream-temperature-web-portal-demonstration-and-application.

Inputs and outputs

Collaborators are still evaluating data collected by various organizations and stream monitoring systems to build a data template and framework for incoming stream temperature data. Once datasets are uploaded to the web portal, users will be able to access monitoring location data and export stream temperature datasets in several formats including:

  • Raw data as csv or html file formats
  • Web services for graphing and downloading data using Water ML2 standards (WML2)

Restrictions and limitations

This web portal is still in development and so many planned features, including uploaded stream temperature datasets, are not yet available.

Accessing the web portal and additional information

Tool and project description: https://necsc.umass.edu/projects/noreast---stream-temperature-web-portal-demonstration-and-application

Beta Verison of NorEaST web portal: http://wim.usgs.gov/NorEaST/

Fast Facts

Website

http://wim.usgs.gov/NorEaST/

Purpose

To provide a coordinated, multi-agency regional framework to compile, store, map, and distribute continuous stream temperature locations and data across the Northeastern U.S. Summaries of regional stream temperature trends and calculation of thermal metrics to relate to fish species response are underway.

Output

An interactive map where users can select stream temperature data sites. Temperature data for each site are either linked to an outside source (e.g. USGS), through web services or will be uploaded to the NorEaST web portal. For uploaded datasets, there are a number of export options including raw data (csv, html) formats or WML2 using web services. Datasets are not yet available for most data points.

Developed by

A number of collaborators from organizations including the USGS (Great Lakes Science Center, Massachusetts Water Science Center, and the Wisconsin Water Science Center),University of Wisconsin Platteville, Michigan State University, and University of Massachusetts Amherst,. Over 41 organizations contributed data to the effort.

Format

Online map and datasets

Geography

Northeastern U.S., including 22 states in New England, the Mid Atlantic, and Great Lakes region. FS Region 9.

Scale (range)

Individual stream – users can select stream sites in specific regions. Regional summaries are underway.

Training Requirement

1 (on a scale of 1-3). Minimal time investment, < 2 hours

Status

The web portal is currently up as a beta version. Not all datasets are accessible yet. Examples of data applications are forthcoming.

Potential Applications

Facilitating better climate vulnerability assessments for aquatic species, enabling coordinated management planning and monitoring efforts, improving the description of habitat quality for aquatic species, stimulating new stream research, communicating with the public about climate effects on stream habitat and fish species.

Caveats, Restrictions

Currently, the web portal is in beta testing. Data are not yet available for many of the stream temperature data sites. Users should be aware that each site may have data for different time periods, and each agency may follow different quality assurance plans, so data may not be directly comparable.