
Overview & Applicability
Rising sea levels are being caused by a change in the volume of the world's oceans due to temperature increase, deglaciation (uncovering of glaciated land because of melting of the glacier), and ice melt. This data viewer can provide a preliminary look at sea level rise and how it might affect coastal resources across the United States (with the exception of Alaska and Louisiana). Data and maps can be used at several scales to help gauge trends and prioritize actions for different scenarios. An associated lake level viewer lets users explore both inundation and decreasing water levels in the Great Lakes.
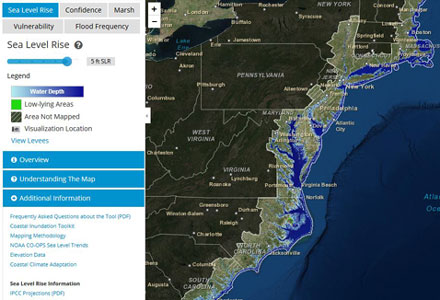
By design, the viewer does not show specific timing of inundation depths. It maps one foot depth increments above Mean Higher High Water (MHHW*) up to 6 feet. This range covers most of the sea level rise projections found in recent scientific literature, which range from extrapolation of the existing sea level trends to >2 meters by 2100. The user can select which inundation level to use, letting the tool serve many projection scenarios and time horizons.
There is not 100% confidence in the elevation data and/or mapping process. Rather than focus on the exact extent of inundation, users are encouraged to examine the confidence in sea level rise projections, which are also mapped through the viewer. Users can also view mapped impacts on marshes and wetlands, socioeconomic vulnerability, and areas susceptible to shallow coastal flooding. Clickable camera icons included in the maps give a visualization of inundation at 0-6 feet above MHHW, using existing photographs edited with the software program CanVis.
Potential coastal changes: See a map of how sea level rise may affect your area.
*MHHW – Mean Higher High Water is The average of the higher high water height of each tidal day observed over the National Tidal Datum Epoch (19 years). It is used as a baseline elevation to capture areas inundated by abnormal events including storm surge and sea level change.
History
The viewer was developed by the NOAA Office for Coastal Management and is a part of their Digital Coast suite of resources. The initial pilot areas for this tool were Houston/Galveston, Texas, and Mississippi, which were mapped in 2011. As of fall, 2014, most of the U.S. coastal areas were mapped, with the exception of Louisiana and Alaska because of data complications. Inundation and lake level drop were mapped for the Great Lakes in a lake level viewer released in 2014.
Regional and local users can obtain the data layers included in this tool or ingest them as Web map services, in order to experiment with implementing them at a regional and/or local level.
Inputs and outputs
Many data layers are displayed in the viewer and different datasets are used depending on the map view output – please see the FAQs Data section for a more thorough explanation.
Elevation data forms the basis for the viewer – highly accurate topographic data was needed to create an accurate picture of inundation. Therefore, the elevation data used to create the layers in the viewer all had to have a root mean square error of <0.6 feet (low relief terrain) or <1.2 feet (high relief terrain. “Areas not mapped” indicate places where elevation data that met accuracy standards were not available.
Maps/outputs include:
- Sea level rise – the inundation effects of 0-6 ft of sea level rise on coasts and low lying areas (hydrologically ‘unconnected’ areas that may flood).
- Mapping confidence – ‘high confidence’ indicates locations that may be correctly mapped as inundated at least 80% of the time. Areas with a low degree of confidence may be mapped correctly as inundated or dry less than 80% of the time. This does not depict any confidence or uncertainty associated with climate change models.
- Marsh – the potential distribution of several marsh and wetland types based on current sea level elevation, projected sea level rise, and sediment accretion.
- Socioeconomic vulnerability – currently includes data from the Social Vulnerability Index along with projected sea level rise, letting the user identify areas with high vulnerability and high potential for flooding. The Economic vulnerability maps are still in development.
- Flood frequency - Depicts areas that are currently subject to shallow coastal flooding (periodic minor-to-moderate flooding events).
Restrictions and limitations
The tool developers include several caveats for interpreting and using the tool outputs.
Chiefly, the data and maps in this tool illustrate the scale of potential flooding, not the exact location, and do not account for erosion, subsidence, or future construction. Water levels are shown as they would appear during the highest high tides (excludes wind driven tides).
In addition:
- These data are for planning, educational, and awareness purposes only and should not be used for site-specific analysis, navigation, or permitting. The data, maps, and information provided should be used only as a screening-level tool for management decisions.
- The mapping does not incorporate future changes in coastal geomorphology and assumes present conditions will persist, which will not be the case.
- The digital elevation model used to map sea level rise does not incorporate a detailed pipe network analysis, or engineering grade hydrologic analysis (for example, culverts and ditches may not be incorporated resulting in incorrectly mapped areas). Therefore, hydrologically unconnected areas of inundation are still displayed, though symbolized differently than hydrologically connected inundation.
- As with all remotely sensed data, all features should be verified with a site visit.
- There is not 100% confidence in the elevation data and/or mapping process. It is important not to only focus on sea level rise tab and the exact extent of inundation, but rather to examine the level of confidence that the extent of inundation is accurate.
- Because the data are spatially averaged and on monthly time steps, short-term and spatially specific events, such as peak runoff that occurs over several days in high elevation sites, are not resolved.
- Alaska and Louisiana are not included in the sea level rise mapping. The Hawaiian Islands, Guam, Saipan, Puerto Rico, and the Virgin Islands are not included in the flood frequency mapping.
Accessing the tool and additional information
Access the sea level rise viewer here: http://coast.noaa.gov/digitalcoast/tools/slr
Access the related lake level viewer here: http://coast.noaa.gov/digitalcoast/tools/llv/
Other related resources can be found under the NOAA-sponsored website Digital Coast: http://www.coast.noaa.gov/digitalcoast/.
Users can also access the data layers that are shown in the viewer to develop regional and local applications:
- File Geodatabases – http://coast.noaa.gov/slrdata/
- Tiled and Cached REST services http://coast.noaa.gov/arcgis/rest/services/dc_slr
If you have questions or comments about the Sea Level Rise and Coastal Flooding Impacts Viewer or want to request data or information, you can submit them via email at csc.info@noaa.gov.