Overview & Applicability
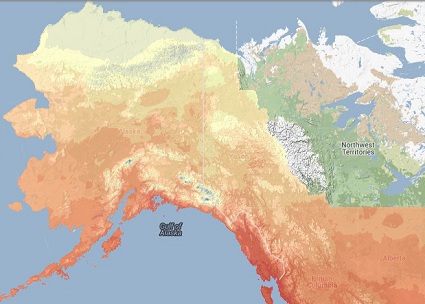
 Climate projection map: SNAP lets users select view climate projections for different emissions scenarios in an online interface
SNAP provides several platforms for looking at historic climate trends and climate projections in Alaska and western Canada:
1. Downloadable datasets for historic climate data and projected climate data (temperature and precipitation).
2. Interactive map - provides climate projections for Alaska and western Canada for each decade through 2100. User can choose what variables, time periods, seasonal averages, and emissions scenarios they’d like to view.
3. Community charts – Allows users to view and download temperature and precipitation projections for individual communities in Alaska and the Arctic.
4. Sea Ice Atlas – Lets audiences explore historic changes in sea ice coverage and download associated data.
5. Online tools for viewing extreme temperature and wind events, and modeled future sea ice coverage.
History
The idea of developing a scenario planning process for Alaska emerged in 2006 from discussions of an interdisciplinary group of faculty at the University of Alaska. It was envisioned as a way that University of Alaska researchers could convey the societal significance of their research to Alaskan decision-makers and other stakeholders.
SNAP was launched in 2007, with Dr. Scott Rupp as Network Director, and a three-person staff. Since then, SNAP has grown to an office of over 30 researchers, programmers, students and staff. Their interactive mapping features were launched in 2012.
Inputs and Outputs
Input
- SNAP chooses a subset of models that perform best in Alaska and the Arctic for projecting climate data, and downscales global model outputs to the local level. Data are projected as a model ensemble.
- SNAP obtains GCM outputs from the Lawrence Livermore National Laboratory Program for Climate Model Diagnosis and Intercomparison (PCMDI) data portal. There are multiple ensemble runs and scenarios available for download from the CMIP3 portal, which uses model outputs from the IPCC Fourth Assessment Report, or AR4. SNAP utilizes the first ensemble model run and the historical 20c3m scenario as well as the projected B1, A1B, and A2 scenarios for downscaling.
- Some of the interactive analysis tools are using data from the CMIP5 portal, which uses models/scenarios from the IPCC Fifth Assessment Report, or AR5.
- See http://www.snap.uaf.edu/downscaling.php#data_sources for more information about model selection and modeling methods.
- For the Sea Ice Atlas, historic sea ice data were compiled from several sources: see http://seaiceatlas.snap.uaf.edu/about .
- Modeled sea ice coverage data does allow the user to view outputs for individual climate models, in addition to a model ensemble.
Output
Several main components:
- Downloadable datasets for historic climate data and projected climate data (temperature and precipitation). Projected data are for an ensemble of 5 GCM’s and 3 emissions scenarios.
- Mapped climate projections for Alaska and western Canada for each decade through 2100. Users can choose what variables, time periods, seasonal averages, and emissions scenarios they’d like to view.
- Charts of temperature and precipitation projections for individual communities in Alaska and the Arctic through 2100.
- Mapped and downloadable data on historic sea ice extent and concentration, as well as animations that show changes in sea ice over time.
- “Data Analysis” tools that let users visualize climate variables including the frequency of extreme daily temperature and wind events (1958 – 2100), historical and projected sea ice extent through 2100, and projected interactions between sea ice and wind events through 2100.
Restrictions and Limitations
Users should note the benefits and drawbacks of using an ensemble of five GCM’s to project temperature and precipitation. In general, the average of a set of GCMs reproduces observed average monthly climate better than any individual model, and could possibly produce a better estimate of average future climate. However, model ensembles are less able to show extreme projections on both ends of the spectrum, and so may mask the true potential range of future climates, particularly where precipitation is concerned. This is addressed somewhat in some applications by allowing users to see the “inter-model variability” for climate projections. Whether it’s better to use the five-model average or individual model projections depend largely on how the data are being used.
Accessing the tool and additional information
Visit the website for more detail on model selection, datasets, downscaling methods and other background information: https://www.snap.uaf.edu/tools-and-data/all-analysis-tools.
A video presentation on global climate models in the Arctic and downscaling can also be found here: http://www.snap.uaf.edu/resource_page.php?resourceid=28.

