
The Greenhouse Effect
The physical mechanisms that cause greenhouse gases to warm the planet, commonly known as the greenhouse effect, are well understood and were scientifically demonstrated beginning in the mid-1800s (Tyndal 1861). Of the solar energy that is directed toward Earth, about 30% is reflected back to space by clouds, dust, and haze (Ramanathan & Feng 2009). The remaining 70% is absorbed by the atmosphere and the Earth’s surface. The Earth’s warmed surface releases some of that absorbed energy as infrared radiation, a form of light, but invisible to human eyes. Greenhouse gases in the atmosphere including carbon dioxide (CO2), methane (CH4), nitrous oxide (N2O), and water vapor, absorb this infrared radiation and keep it from passing into space. This energy is then reradiated in all directions, and the energy that is directed back toward the Earth warms the planet.
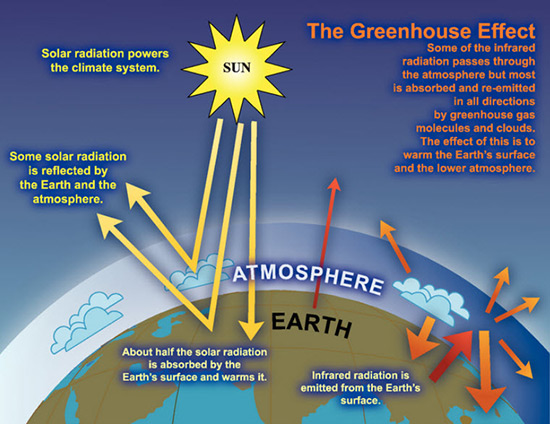
Figure 4 -An idealized model of the greenhouse effect. Source: IPCC 2007 Ch.1
Human Influence on Greenhouse Gases
The greenhouse effect is a natural process, and without greenhouse gases in the Earth’s atmosphere, the average temperature on the surface of the Earth would be would be about zero degrees Fahrenheit (IPCC 2007 Ch.1). However human activities have led directly to increases in greenhouse gas concentrations and therefore an enhanced greenhouse effect, causing warming on the Earth’s surface.
The 2007 United Nations Intergovernmental Panel on Climate Change (IPCC) Fourth Assessment Report (AR4) emphasized the clear link between human-caused greenhouse gases and observed climate changes. The most recent IPCC Assessment (AR5) represents the most substantive evaluation of climate change to date, and strengthens this link even further, observing " Human influence has been detected in warming of the atmosphere and the ocean, in changes in the global water cycle, in reductions in snow and ice, in global mean sea level rise, and in changes in some climate extremes. This evidence for human influence has grown since AR4. It is extremely likely [95-100% certainty] that human influence has been the dominant cause of the observed warming since the mid-20th century.” (IPCC 2013, Summary for Policymakers). Independent studies using a variety of methods strongly corroborate this conclusion (e.g. Lean 2010, Huber & Knutti 2011). Examinations and model simulations of many possible explanations of global warming show that we can only explain the strong temperature increases of the past 120 years if we account for human influences (Figure 5).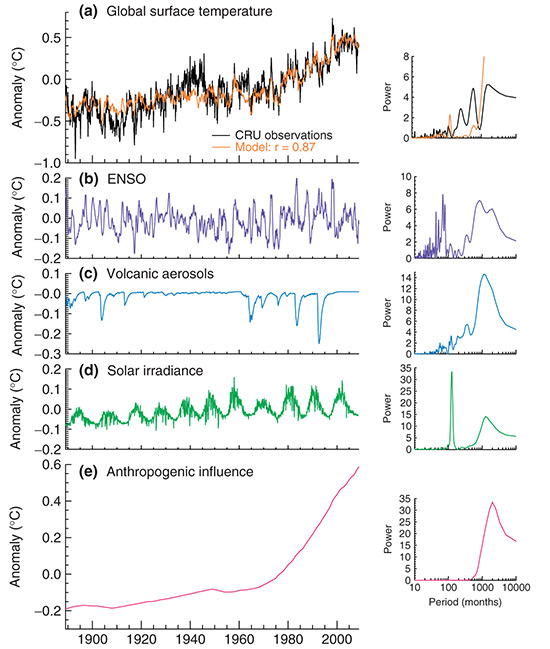
Figure 5 - Contributions of to the average monthly global surface temperatures by individual ENSO [El Niño], volcanic, solar, and human-caused influences. Source: Lean 2010
Human activity has had the most notable impact on carbon dioxide concentrations, which as noted earlier, have increased dramatically (Figure 2), mainly through fossil fuel burning, cement production, and deforestation. Methane, another potent greenhouse gas, is emitted by processes such as decomposition in wetlands, and from activities such as rice and livestock agriculture and biomass burning. Human-caused sources of methane are estimated at 50-65% of total global methane emissions for the 2000’s (IPCC 2013 Ch.6). Nitrous oxides have been increasing due in part to agricultural fertilization and fossil fuel burning; other gases emitted from industrial processes, such as halocarbons, also play a role in warming (Figure 5). Many of these greenhouse gases are likely to reside in the atmosphere for decades to centuries (CDIAC 2014). The most abundant greenhouse gas is water vapor, but water vapor is short lived in the atmosphere (on the order of days) and is dependent on temperature. So, human activities have little direct influence on water vapor, although human-caused warming can increase water vapor concentrations and amplify the warming effect (Held and Soden 2000).
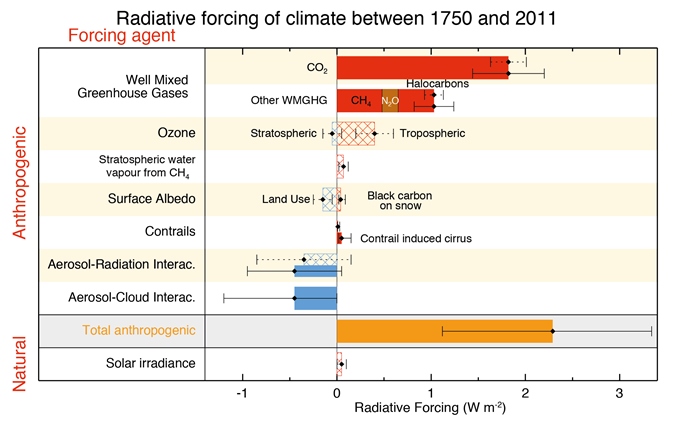
Figure 6 -The amount of warming influence (red bars) or cooling influence (blue bars) that different factors have exerted on the Earth’s climate over the industrial era (from 1750 – 2011). A longer bar signifies a greater influence. Source: IPCC 2013 Ch.8
Need more information?
See the following primers and resources for more introductory information on climate change.
Climate Change Resource Center:
FAQs
United States Global Change Research Program:
The Third National Climate Assessment
NASA Global Climate Change
Climate change: How do we know?
Center for Climate and Energy Solutions:
Climate Change – The Basics
Cooperative Institute for Research in Environmental Sciences:
Reading the IPCC Report - Recorded seminar series
Anderson A.; Bows, A. 2011. Beyond 'dangerous' climate change: emission scenarios for a new world. Philosophical Transactions of the Royal Society. 369: 20-44.
Bond, G.; Kromer, B.; Beer, J.; Muscheler, R.; Evans, M.; Showers, W.; Hoffmann, S.; Lotti-Bond, R.; Hajdas, I.; Bonani, G. 2001. Persistent solar influence on North Atlantic climate during the Holocene. Science. 294: 2130-2136.
Carbon Dioxide Information Analysis Center (CDIAC). 2014. Recent Greenhouse Gas Concentrations. (Accessed 10-31-2014)
Deser, C.; Alexander, M.A.; Xie, S.P.; Phillips, A.S. 2010. Sea Surface Temperature Variability: Patterns and Mechanisms. Annual Review of Marine Science. 2: 115-143.
Global Carbon Project. 2014. Carbon budget and trends 2014. (Accessed 10-20-2014)
Hansen, J.E. 2003. Can we defuse the global warming time bomb? (Accessed 10-31-2014)
Held, I.M.; Soden, B.J. 2000. Water vapor feedback and global warming. Annual Review of Energy and the Environment. 25:441-475.
Huber, M.; Knutti, R. 2011. Anthropogenic and natural warming inferred from changes in Earth's energy balance. Nature Geoscience. Advance Online Publication.
IPCC, 2007: Climate Change 2007: The Physical Science Basis. Contribution of Working Group I to the Fourth Assessment Report of the Intergovernmental Panel on Climate Change [Solomon, S.; Qin, D.; Manning, M.; Chen, Z.; Marquis, M.; Averyt, K.B.; Tignor, M.; Miller, H.L. (eds.)]. Cambridge University Press, Cambridge, United Kingdom and New York, NY, USA.
IPCC, 2011: Summary for Policymakers. In: Intergovernmental Panel on Climate Change, Special Report on Managing the Risks of Extreme Events and Disasters to Advance Climate Change Adaptation [Field, C. B.; Barros, V.; Stocker, T.F.; Qin, D.; Dokken, D.; Ebi, K.L.; Mastrandrea, M. D.; Mach, K. J.; Plattner, G.K.; Allen, S.; Tignor, M.; Midgley, P. M. (eds.)]. Cambridge University Press, Cambridge, UK and New York, NY, USA.
IPCC, 2013: Climate Change 2013: The Physical Science Basis. Contribution of Working Group I to the Fifth Assessment Report of the Intergovernmental Panel on Climate Change [Stocker, T.F., D. Qin, G.-K. Plattner, M. Tignor, S.K. Allen, J. Boschung, A. Nauels, Y. Xia, V. Bex and P.M. Midgley (eds.)]. Cambridge University Press, Cambridge, United Kingdom and New York, NY, USA.
Lean, J. 2010. Cycles and trends in solar irradiance and climate. Wiley Interdisciplinary Reviews: Climate Change. 1: 111-122.
Li, J.; Xie, S.-P.; Cook, E.R.; Morales, M.; Christie, D.; Johnson, N.; Chen, F.; D'Arrigo, R.; Fowler, A.; Gou, X.; Fang, K. 2013.El Niño modulations over the past seven centuries. Nature Climate Change. 3:822-826.
Mann, M.E.; Zhang, Z.; Rutherford, S.; Bradley, R.S.; Hughes, M.K.; Shindell, D.; Ammann, C.; Faluvegi, G.; Ni, F. 2009.Global Signatures and Dynamical Origins of the Little Ice Age and Medieval Climate Anomaly. Science. 27 (326): 1256-1260.
Mantua, N. J.; Hare, S. R.; Zhang, Y.; Wallace, J. M.; Francis, R.C. 1997. A Pacific interdecadal climate oscillation with impacts on salmon production. Bulletin of the American Meteorological Society 78:1069-1079.
NASA Global Climate Change. 2014. Vital Signs of the Planet. (Accessed 10-31-2014).
NASA Goddard Institute for Space Studies. 2014. NASA Finds 2013 Sustained Long-Term Climate Warming Trend. Research News. (Accessed 10-31-2014).
NASA Earth Observatory. 2000. Features: Milutin Milankovitch. (Accessed 10-31-2014).
NASA Earth Observatory. 2009. Features: El Nino, La Nina, and Rainfall. (Accessed 10-31-2014).
NOAA Earth System Research Laboratory. 2014. Mauna Loa Observatory. (Accessed 10-31-2014)
NOAA National Climatic Data Center. 2014. (Accessed 10-31-2014).
Ramanathan, V.; Feng, Y. 2009. Air pollution, greenhouse gases and climate change: Global and regional perspectives. Atmospheric Environment. 43: 37-50.
Tyndal J. 1861. On the absorption and radiation of heat by gases and vapours, and on the physical connexion of radiation, absorption, and conduction. Philosophical Magazine. 22:169-94, 273-85
United States Global Change Research Program (USGCRP). 2009. Global Climate Change Impacts in the United States. Karl, T.R.; Melillo, J.M.; Peterson, T.C. (eds). Cambridge University Press.
U.S. Global Change Research Program. 2014. The Third National Climate Assessment. Melillo, J.M.; Richmond, T.C.; Yohe, G.W. (eds.). 841 p.
Wanner, H.; Beer, J.; Butikofer, J.; Crowley, T.J.; Cubasch, U.; Fluckiger, J.; Goosse, H.; Grosjean, M.; Joos, F.; Kaplan, J.O.; Kuttel,M.; Muller, S.A.; Prentice, C.; Solomina, O.; Stocker, T.F.; Tarasov, P.; Wagner,M.; Widmann, M. 2008. Mid- to Late Holocene climate change: an overview. Quaternary Science Reviews. 27: 1791-1828.
Wolff, E.W. 2011. Greenhouse gases in the Earth system: a palaeoclimate perspective. Philosophical Transactions of the Royal Society. 369: 2133-2147.
